Table of Contents
Overview
The Salesforce app lets you show Salesforce chart data on your screens in a format optimized for digital signage. It recreates supported Salesforce charts inside Yodeck, making it easier to share KPIs, pipeline updates, sales performance, and other business metrics across offices, meeting rooms, and shared spaces.
ℹ️Best used for: teams that want to share live Salesforce KPIs and dashboard insights on office screens without asking employees to log in to Salesforce.
Before you start
Before you connect Salesforce to Yodeck, make sure you have:
- A Salesforce account with administrator access
- Access to Salesforce Setup
- An active Yodeck account
Which types of dashboards are supported and which are not?
| Supported: | Salesforce app supports native Salesforce dashboards only. It also works with dashboards created in Salesforce Lightning. |
| Not Supported: | Salesforce Classic dashboards are not supported by the app. Additionally, dashboards created with add-ons or external analytics tools, such as: – CRM Analytics / Einstein Analytics / CRME – Salesforce Labs dashboard packs – Third-party solutions from the Salesforce App Exchange are also not supported. This is because they use data models or visualization features that are not available through Salesforce’s native dashboard API. |
Chart support at a glance
Below is a simple overview of how each chart type behaves in Yodeck. Click on each expandable arrow to view more information about each Chart:
Horizontal Bar Chart
Best for: comparing categories side by side.
Works with: single-group reports.
Expect: possible label truncation, color differences, and fewer visible bars on denser layouts.
Vertical Bar Chart
Best for: comparing categories in a column layout.
Works with: single-group reports.
Expect: possible label truncation, color differences, and fewer visible bars depending on layout.
Stacked Horizontal Bar Chart
Best for: showing totals and category breakdowns together.
Works with: reports that use two groupings.
Expect: Yodeck uses the first grouping as the main axis and the second as the stacked breakdown.
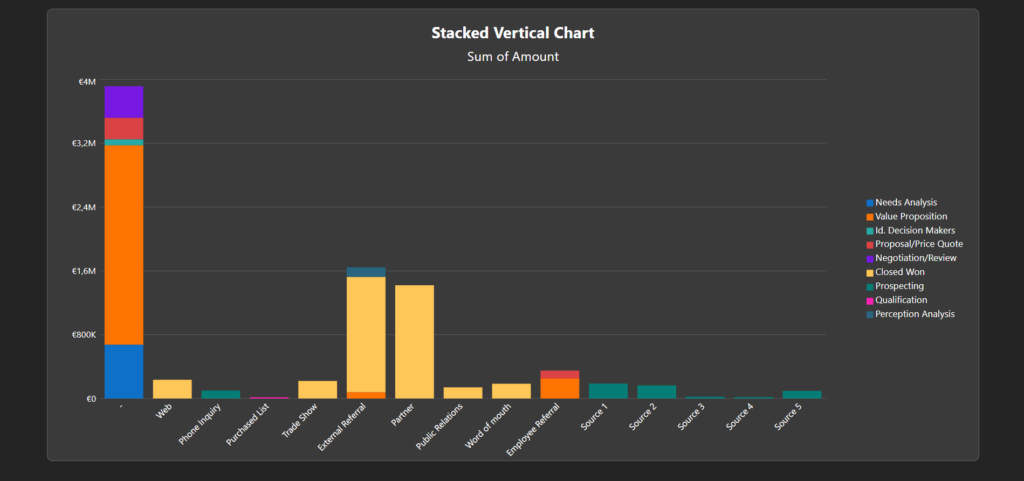
Stacked Vertical Bar Chart
Best for: showing totals and category breakdowns in vertical columns.
Works with: reports that use two groupings.
Expect: Yodeck uses the first grouping as the main axis and the second as the stacked breakdown.
Line Chart
Best for: showing trends over time or across a sequence.
Works with: single-group reports.
Expect: fewer visible values on denser layouts and fewer customization options than Salesforce.
Donut Chart
Best for: showing each category’s share of the total.
Works with: grouped data with limited categories.
Expect: legends on the right, possible color differences, and smaller groups combined into Others when needed.
Funnel Chart
Best for: visualizing stages in a process.
Works with: grouped data with limited categories.
Expect: legends on the right, possible color differences, and smaller groups combined into Others when needed.
Scatter Chart
Best for: showing the relationship between two measures.
Works with: single-group reports.
Expect: support for core scatter functionality, but not all advanced Salesforce options.
Gauge Chart
Best for: showing progress toward a range or target.
Works with: single-value summary data.
Expect: a simpler screen-friendly version of the Salesforce chart.
Metric Chart
Best for: highlighting a single KPI.
Works with: single aggregated values.
Expect: one of the most straightforward chart types to display on screen.
⚠️Note: Salesforce Lightning tables are not supported, even if they appear in a Salesforce app.
Why charts may look different in Yodeck
Because Yodeck rebuilds charts from Salesforce data instead of rendering the original dashboard, some differences are expected.
⚠️You may notice differences in colors, sorting, grouping behavior, legend placement, number of values shown, axis label length, and overall chart density. Charts with a lot of data may also be simplified so they stay readable on screen.
General limitations
The following general limitations apply across the app.
- Numeric precision: Chart values support up to 2 decimal places.
- Custom links: Custom links from Salesforce dashboards are not supported.
- Reports with multiple groupings: If a Salesforce report contains more than one grouping field:
- Legends: For charts that use legends:
- legends always appear on the right
- legend values cannot be sorted
- Interactivity: Salesforce app is not interactive, and therefore it does not support:
- drill-downs
- hover states
- filtering
- deep navigation inside charts or dashboards
Disclaimer
Salesforce does not provide a way to render dashboards outside its own interface. Because of that, Yodeck does not display the original dashboard directly. Instead, the Salesforce app in Yodeck:
- connects to Salesforce through the Salesforce API
- retrieves dashboard data and metadata
- rebuilds supported charts inside Yodeck for screen display
This means your charts may not look exactly the same as they do in Salesforce. In most cases, differences are caused by API limitations and by the need to keep charts readable on digital signage screens.
Connect Salesforce to Yodeck
To use the Salesforce app, you need to first create an External Client App in Salesforce and then enter its credentials in Yodeck.
Step 1: Create an External Client App in Salesforce
- Log in to Salesforce.
- Click the gear icon in the top-right corner and select Setup.
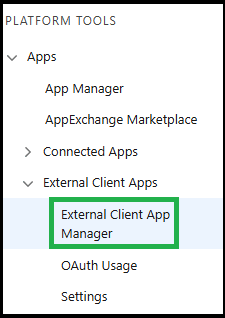
- Go to Apps > App Manager.
- Click External Client Apps, then External Client App Manager.
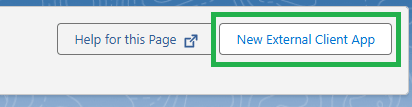
- Then locate and click the New External Client App button.
- Proceed to the second step of the process, where you fill in the required fields.
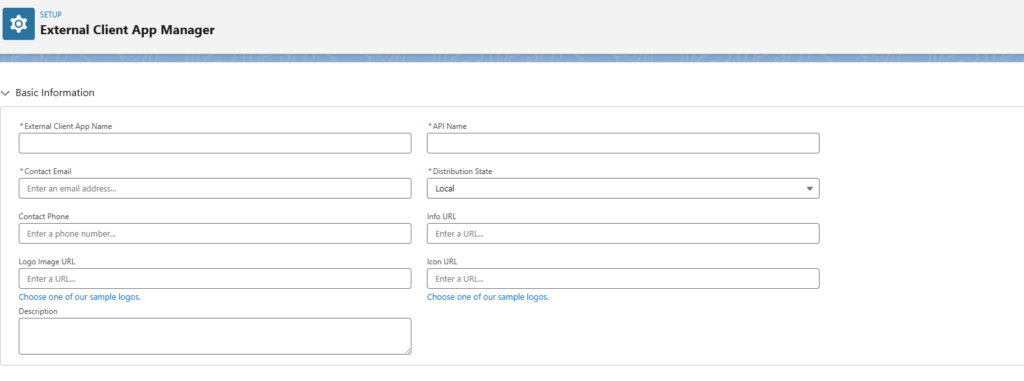
Step 2: Configure OAuth settings
Fill in the required fields:
- External Client App Name: for example,
Yodeck Integration - API Name: this fills in automatically
- Contact Email: enter your email address
In the same form:
- Scroll to API (Enable OAuth Settings).
- Enable OAuth Settings.
Then you must configure the following four settings:
| App Settings | Selected OAuth Scopes | Flow Enablement | Security |
| For the Callback URL: enter any valid URL, such as: ℹ️Salesforce requires this field, but Yodeck does not use it for the Client Credentials flow. | Add these scopes: Access the identity URL service (id, profile, email, address, phone) Manage user data via APIs (api) | Enable Client Credentials Flow. | Enable the Issue JSON Web Token (JWT)-based access tokens for named users. |
⚙️When you are done, click the Create button.
ℹ️Note: Salesforce may need 2 to 10 minutes to apply the changes.
Step 3: Configure the Client Credentials policy
After creating the app:
- Open your External Client App.
- Go to Policies and click Edit.
- Scroll to OAuth Policies > OAuth Flows and External Client App Enhancements.
- Enable Client Credentials Flow.
- In Run As (Username), enter the email address of the Salesforce user whose access Yodeck should use.
- Click Save.
ℹ️The selected user’s permissions determine which dashboards and data Yodeck can access.
Step 4: Copy your Consumer Key and Consumer Secret
- Go to Setup > Apps > External Client Apps > External Client App Manager.
- Find your app.
- Open Settings > OAuth Settings.
- Click Consumer Key and Secret.
- Copy both values.
⚠️Important: Keep your Consumer Secret secure.
Step 5: Find your Salesforce custom host
Look at the Salesforce URL you use to sign in.
It follows this format: https://your-custom-host.my.salesforce.com
For example, if your URL is: https://mycompany.my.salesforce.com
Your custom host is: “mycompany“.
Enter your credentials in the Yodeck Salesforce app
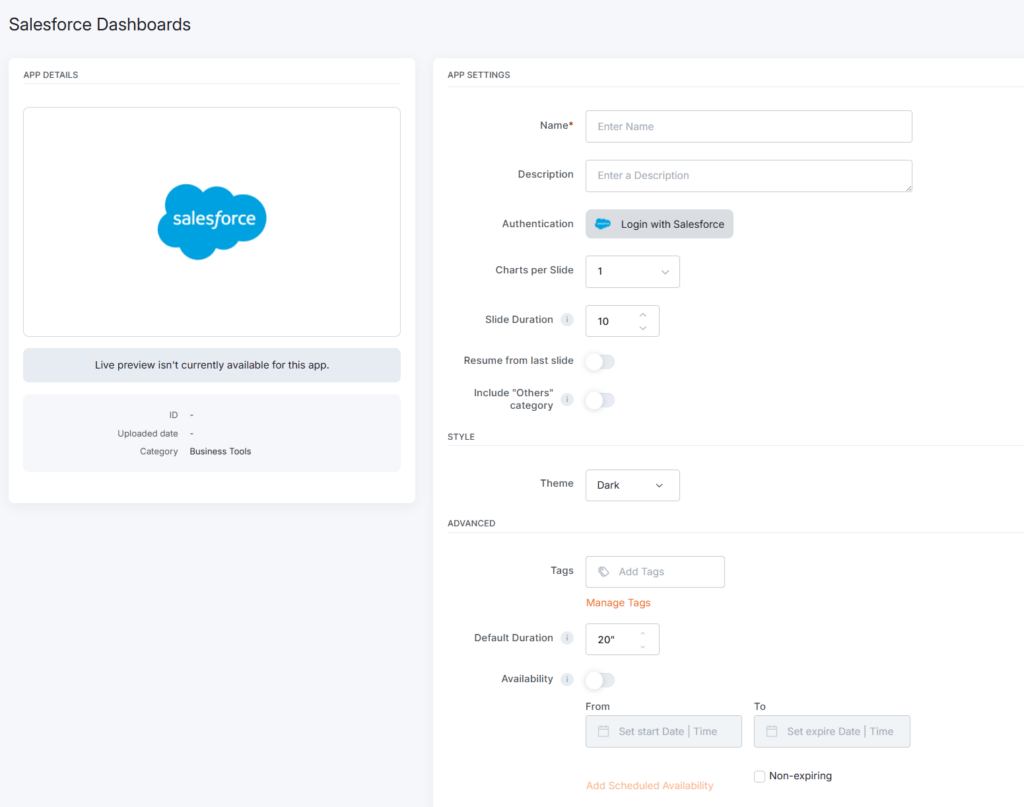
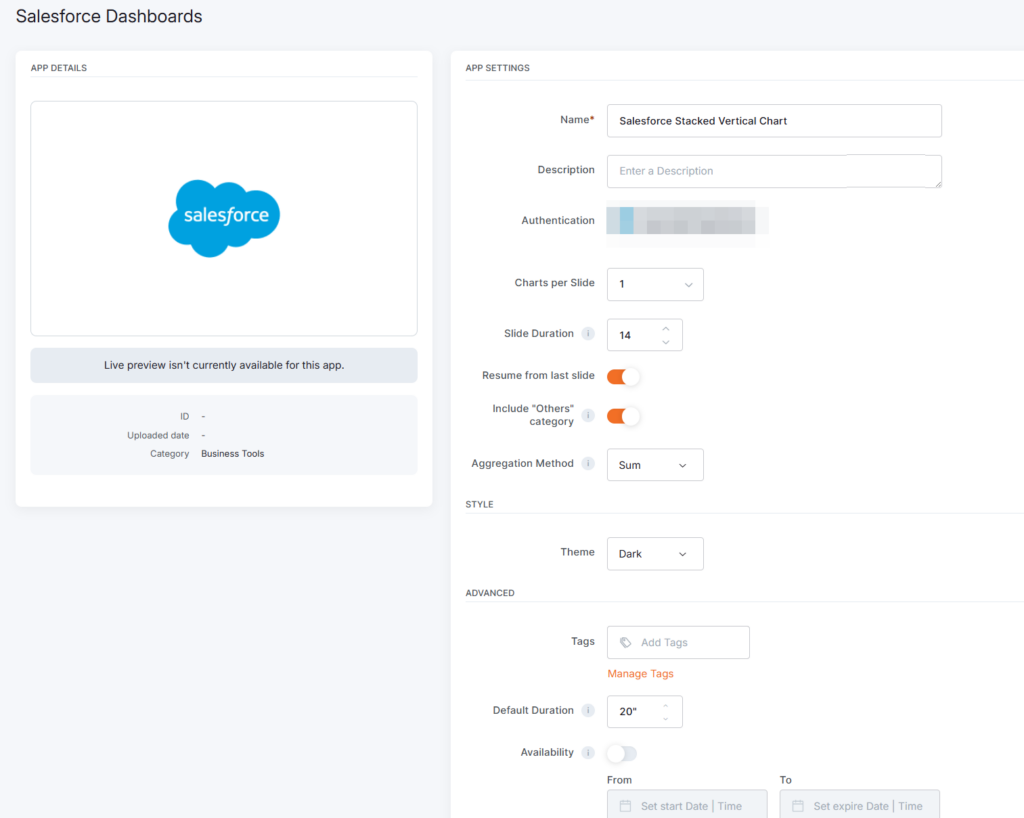
To display Salesforce app content on your Yodeck screens, click on the Salesforce app within your app gallery to set it up, and complete the app details as follows:
- Name: You first need to provide a name for the app.
- Description: You can include an optional description.
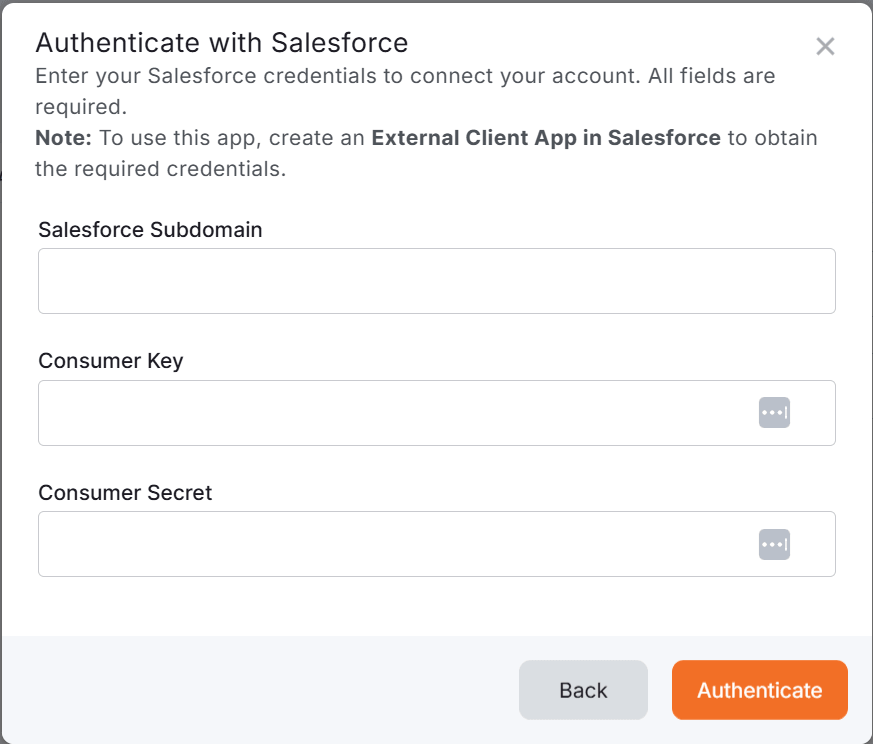
- Authentication: To display your Salesforce app content, you must first click the Authentication button, and on the pop-up window that appears, fill in the following obligatory authentication fields:
- Custom Host: Your Salesforce custom host (Salesforce subdomain), for example “
mycompany". - Consumer Key: The Consumer Key from Salesforce.
- Consumer Secret: The Consumer Secret from Salesforce.
- Click Authenticate.
ℹ️Yodeck will verify the credentials with your Salesforce instance. - Once the authentication succeeds, you can select a Salesforce dashboard and choose which supported charts to include in your app from the available Salesforce dashboards. By default, all charts in the selected dashboard are included. You can deselect any charts you do not want to show on screen.
- Custom Host: Your Salesforce custom host (Salesforce subdomain), for example “
- Charts per slide: The following three options are available for showing charts in a slideshow layout.
- 1 chart per slide
- 2 charts per slide
- 4 charts per slide
- Slide Duration: From this option, you can specify the slide duration (minimum is 5 seconds).
- Resume from last slide: When you enable this option for Playlists and Schedules, the playback resumes from the last slide instead of starting from the beginning.
- Include “Others” category: If there are multiple columns in a graph or chart that our app cannot display correctly, enabling this option will automatically group the data from those hidden columns under a category labeled “Others.”
- Once enabled, the Aggregation Method option appears under the aforementioned field: Choose whether the “Other” collapsed category should be the sum or average of the rest of the values.
- Theme: This option allows you to choose whether the app’s central theme will be Light (white), Black, or Custom, essentially dictating the main color background.
- Tags: You can also provide a tag for this app to manage it better.
- Default Duration: You can configure this option so that the App will appear in a playlist for a specific duration.
- You can also set the Availability. You can find more details in the Media Availability guide.
- Click “Save,” and your App is ready to use.
Salesforce app Final Result
The examples below showcase how Yodeck displays Salesforce dashboards in its preview and screens.
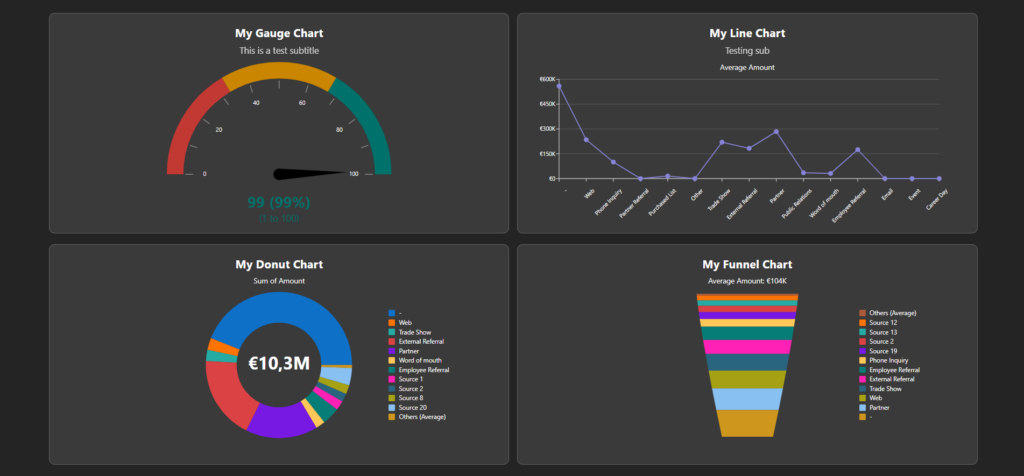
Layout and chart density
The Salesforce app shows charts in a slideshow layout. You can choose 1, 2, or 4 charts per slide.
As you add more charts to a slide, each chart gets less space. To keep charts readable, Yodeck automatically limits how much data each chart can show. In general:
- fewer charts per slide = more detail
- more charts per slide = less detail
For example, a horizontal bar chart with a single measure can show:
| Charts per slide | Maximum bars displayed |
|---|---|
| 1 chart | Up to 20 |
| 2 charts | Up to 15-20 |
| 4 charts | Up to 7 |
ℹ️This behavior applies across supported chart types. The exact amount of visible data depends on the chart type and layout.
Best practices
To get the best results with Salesforce app:
- use native Salesforce Lightning dashboards
- keep charts as simple as possible
- avoid very dense reports with many nested groups
- use fewer charts per slide when readability matters
- expect some visual differences between Salesforce and Yodeck
If a chart feels crowded on screen, try reducing the number of charts per slide or simplifying the source report in Salesforce.
Troubleshooting
– Authentication fails -> Check that:
- the Consumer Key and Consumer Secret are correct
- the custom host is entered correctly
- the Client Credentials flow is enabled
- the selected Salesforce user has access to the dashboards you want to use
– A dashboard does not appear -> Check that:
- the dashboard is a native Salesforce Lightning dashboard
- the selected Salesforce user has access to it
- the dashboard is not built with CRM Analytics or another unsupported tool
– A chart looks incomplete -> Check that:
- the chart type is supported
- the source report is not too complex
- the selected slide layout is not reducing visible data too much
- the chart is not using unsupported Salesforce behavior or grouping logic
F.A.Q.s
Got questions? We’ve got answers! This section addresses common questions about the Yodeck Salesforce app.
Yodeck recreates the chart from Salesforce data instead of rendering the original Salesforce dashboard. Because of that, some visual differences are expected, especially in colors, grouping behavior, legend placement, and the number of displayed values.
To keep charts readable on digital signage screens, Yodeck may limit the number of visible values or combine smaller groups into an Others category. The exact result depends on the chart type and the selected layout.
If your Salesforce report uses multiple grouping levels, Yodeck only uses the first grouping for standard charts and the first two groupings for stacked charts.
No. The Salesforce app supports dashboards created in Salesforce Lightning only.
No. Salesforce Lightning tables are not supported at this time.
The Salesforce app is designed for display, not interaction. It does not support drill-downs, filters, hover states, or deep navigation.
Yodeck uses the permissions of the user set in the Run As (Username) field when you configure the Client Credentials policy in Salesforce.
For stacked charts, Yodeck uses the first grouping as the main category and the second grouping as the stacked breakdown. If you want a different result, change the grouping order in the Salesforce report itself.
When screen space becomes limited, Yodeck reduces chart detail to keep content readable. Some chart types may show fewer values, groups, or labels in denser layouts.
No. The Salesforce app supports native Salesforce dashboards only.
If your dashboard depends on advanced Salesforce customization, the Yodeck version may appear simplified. The Salesforce app is designed to reproduce supported data visually in a way that stays readable on screen, not to match every Salesforce behavior exactly.
Need Help?
The Yodeck Support Team can help you out! Log in to your Yodeck account and send us a message from the bottom right corner!