Table of Contents
Overview

Yodeck now supports visualizing ServiceNow data on your screens through our Grafana App. This guide shows you how to connect ServiceNow to Grafana, use ready-made dashboard templates, and publish live visualizations on your Yodeck players.
Prerequisites
Before you start, ensure you have:
- A ServiceNow user with access to the tables you wish to visualize.
- A Yodeck Premium plan (includes Grafana integration).
- A Grafana Cloud Free account and the ServiceNow Enterprise Plugin.
- Pricing details can be found here.
- No plugin purchase needed if you already have:
- Grafana Cloud: Pro, Advanced, or Pro trial with Enterprise plugin add-on.
- Grafana Enterprise: Activated license + server/org admin user permissions.
Connect ServiceNow to Grafana
This technical guide consists of three phases and eight steps. Follow it carefully to achieve the desired result.
Step 1 — Log in & Open Plugins
- Log in to your Grafana instance.
- Go to Administration → Plugins and data → Plugins.
- Search for “ServiceNow”.
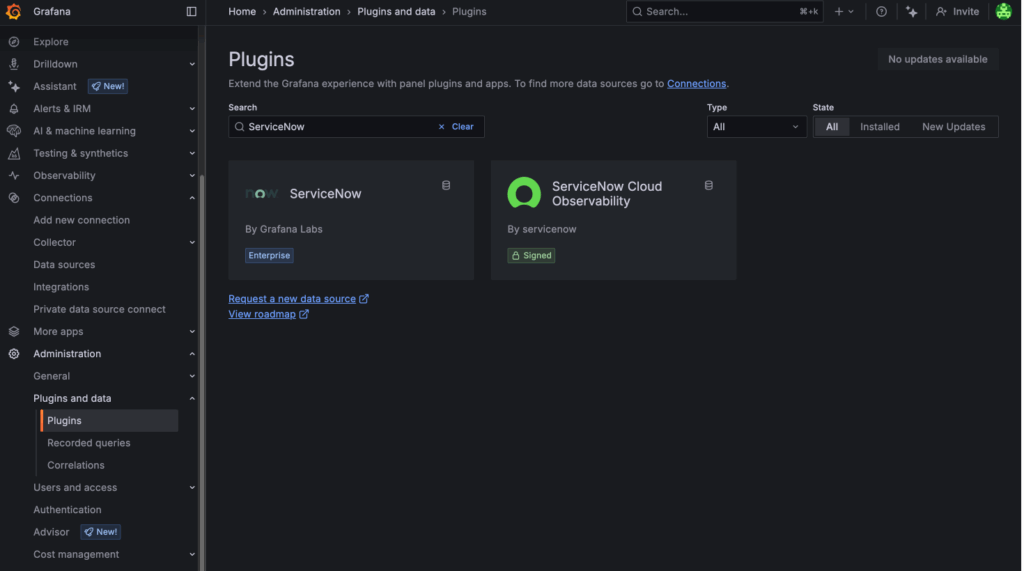
Grafana Plugins page showing ServiceNow pluginStep 2 — Install the ServiceNow Plugin
- Select the ServiceNow plugin.
- Click Install.
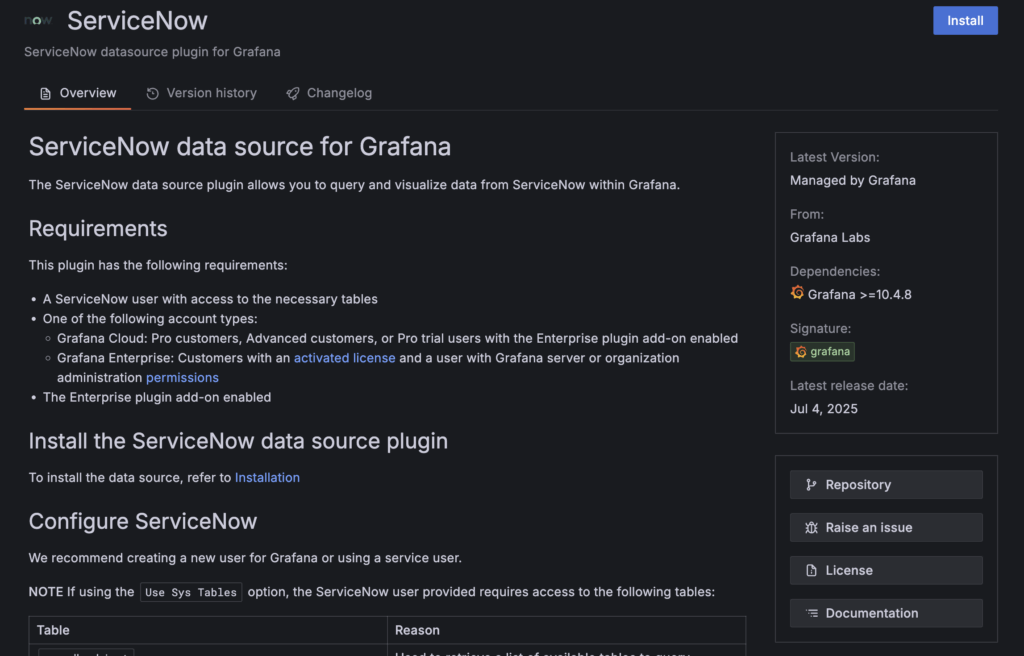
ServiceNow plugin page showing Install button in GrafanaStep 3 — Create a New Data Source
6. After installation, click Add new data source.
- If it doesn’t appear, refresh the page.
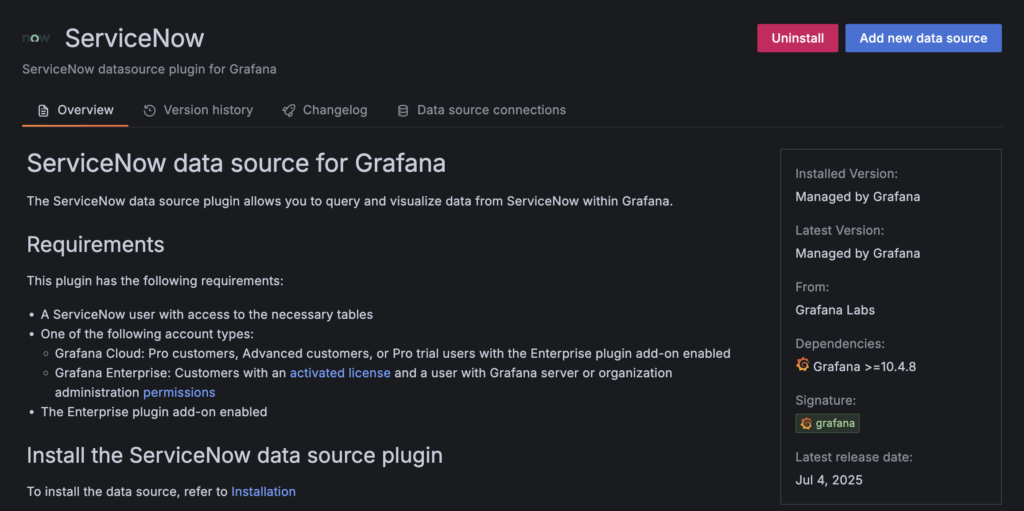
Grafana interface with 'Add new data source' button visibleStep 4 — Configure the Data Source
- Enter your ServiceNow instance URL and credentials.
- Click Save & Test to validate your connection.
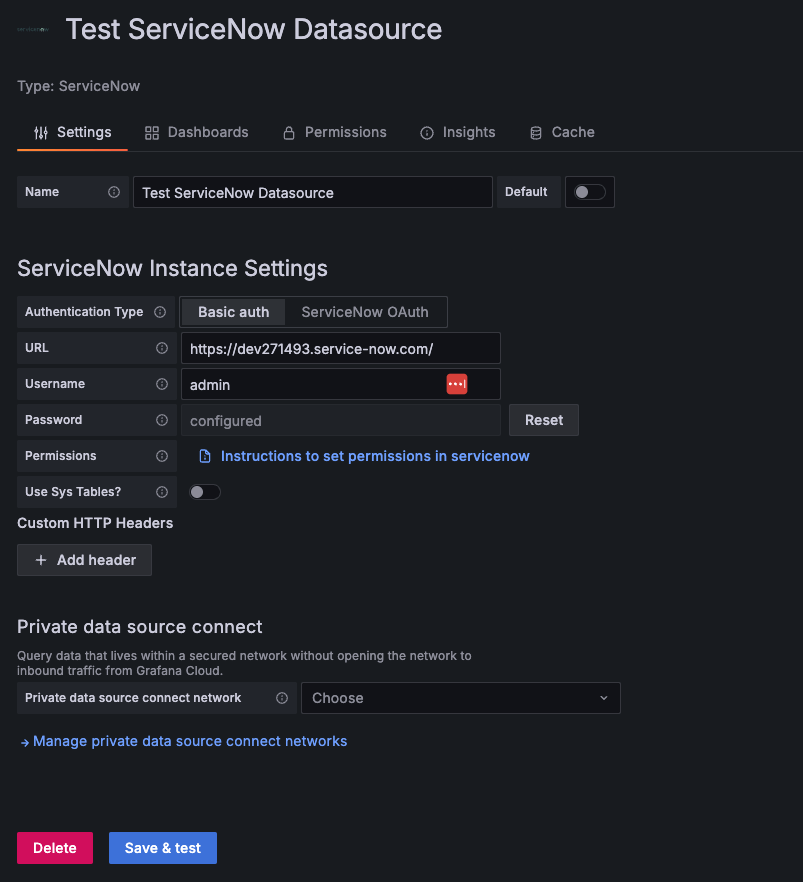
ServiceNow data source configuration form in GrafanaCreate a Visualization for Your ServiceNow Data
Yodeck provides ready-to-use Grafana dashboard templates, starting with the Asset Overview Dashboard. You can import a template or create your own.
Below you can download one of our premade templates:
Just click on the “Download” text to download it and use it.
➡️ServiceNow Asset Overview Dashboard-1756285051680 Download
Step 5 — Import a Dashboard Template
- In Grafana, go to: Dashboards → New → Import.
- Drag & drop the dashboard JSON file.
- Click Load.
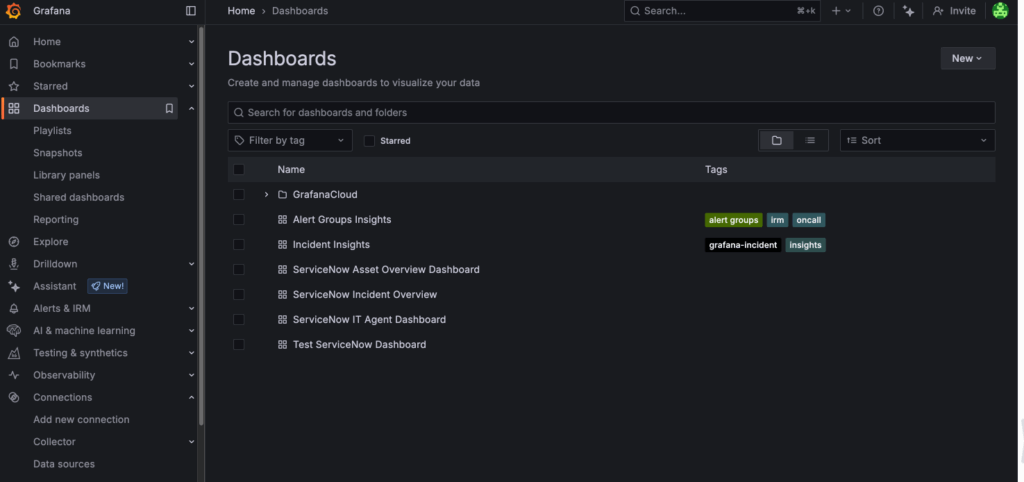
Grafana Import Dashboard menu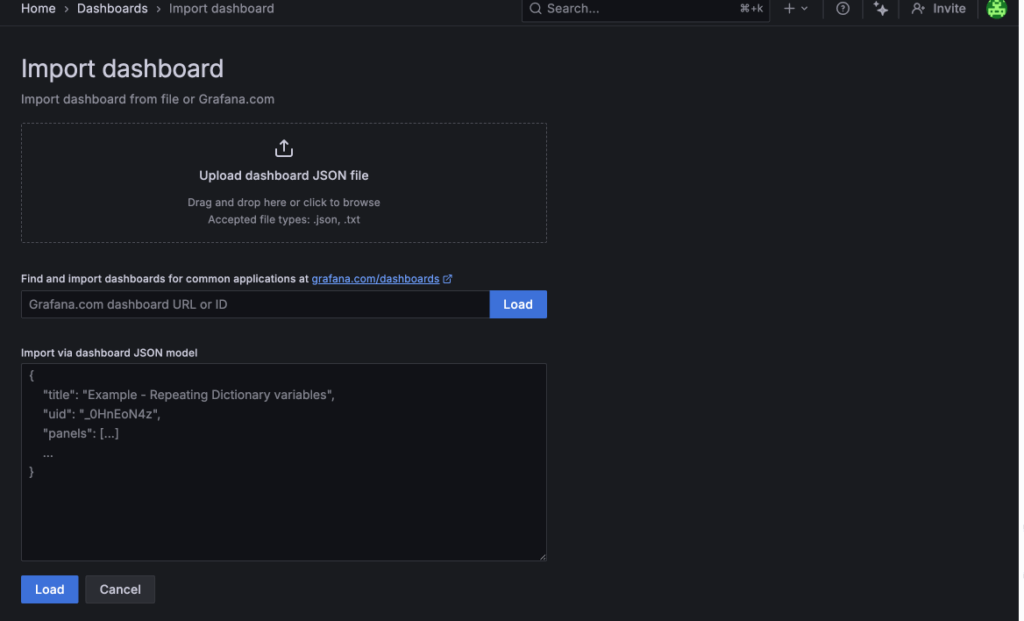
Uploading a JSON template file into Grafana Import screenStep 6 — Select Your ServiceNow Data Source
- Edit the dashboard name and location as needed.
- In the data source field, select the ServiceNow Data Source you created earlier.
- Click Import.
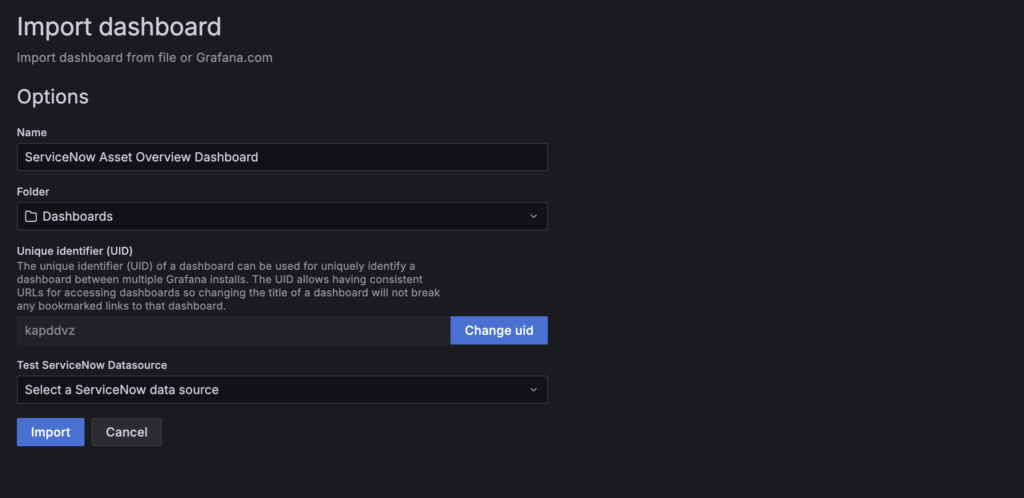
Selecting ServiceNow data source while importing Grafana dashboardYour configured dashboard will appear immediately.
You may customize visualizations, set KPIs, and adjust the refresh rate (minimum 5 seconds in Grafana).
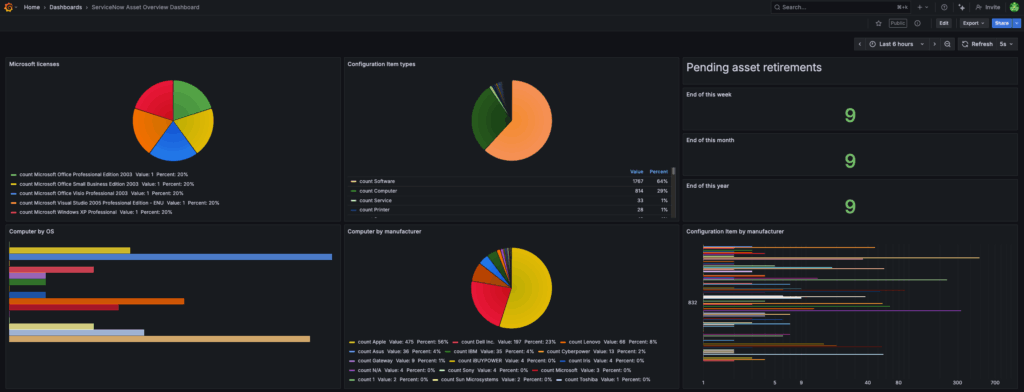
Completed Grafana dashboard visualizing ServiceNow dataDisplay Your ServiceNow Dashboard on Yodeck Screens
Once your dashboard is ready, follow these steps to publish it through your Yodeck account.
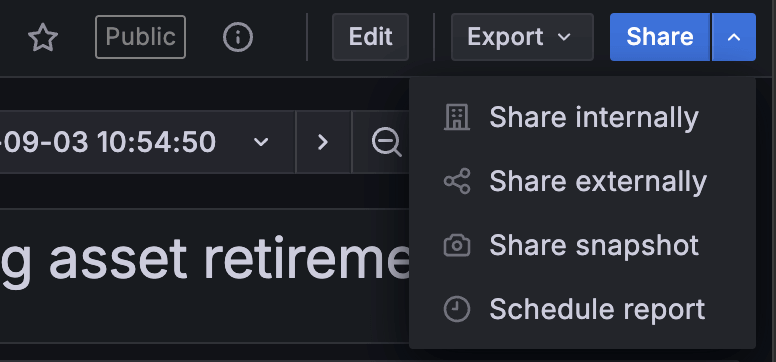
Step 7 — Copy the Dashboard URL in Grafana
- In Grafana, open the top-right Share or Share internally menu.
- Copy the provided dashboard URL.
Step 8 — Create a Grafana App in Yodeck
- Log in to Yodeck.
- Go to Apps → Create App → Grafana App.
- Paste the dashboard URL and enter your Grafana credentials (username & password.
- Click Save.
Your Grafana-based ServiceNow visualization is now ready to assign to screens or shows.
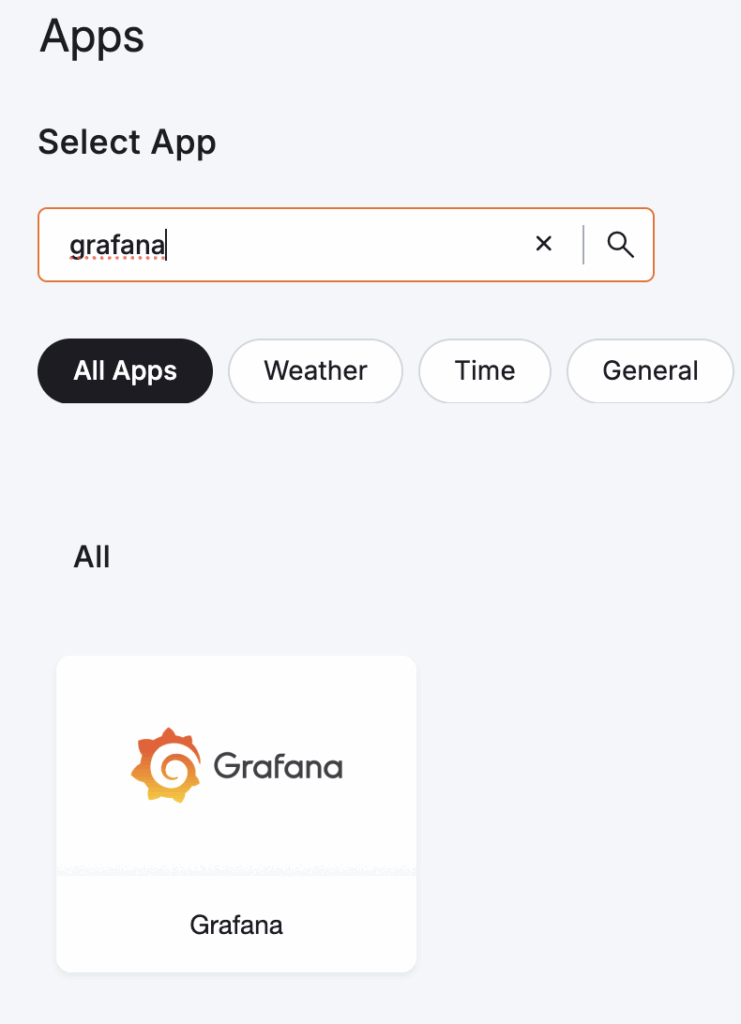
Grafana App inside the Yodeck app gallery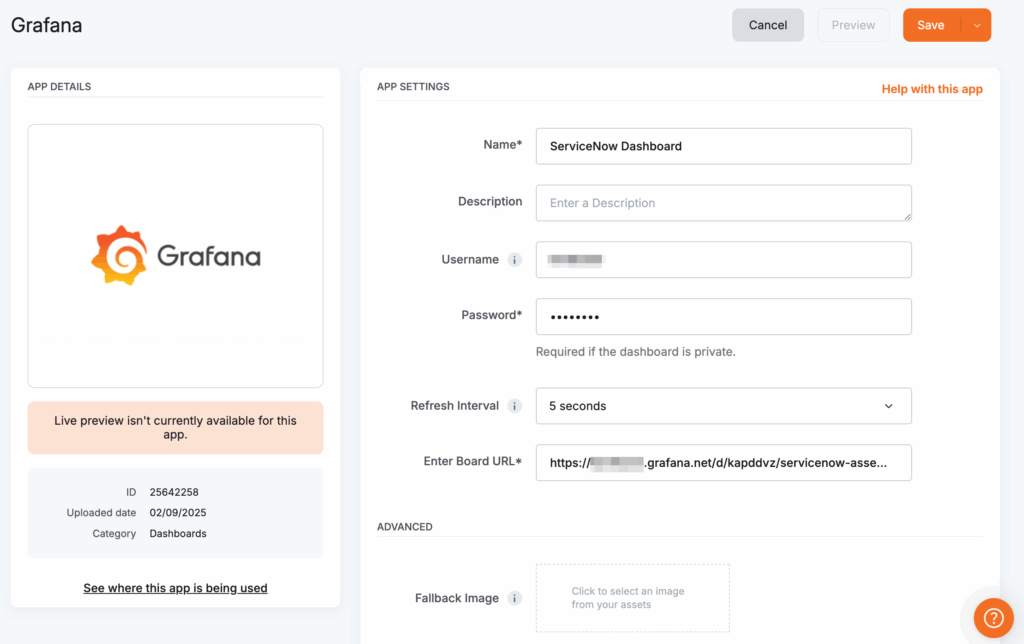
Configuration page of the Grafana app in YodeckImportant Note About Refresh Rates
It is important to understand that the Refresh Interval in Grafana corresponds to the rate your data source is being refreshed in contrast to the Refresh Interval in Yodeck, which corresponds to the rate the Yodeck app is reloaded on your screens. Therefore, these Refresh Intervals are independent settings.
Troubleshooting
“Add new data source” button does not appear
- Refresh the page
- Log out and back in
Invalid ServiceNow credentials
- Ensure correct table access
- Verify instance URL formatting
Dashboard does not refresh on Yodeck
- Check Grafana’s refresh rate (min 5 seconds)
- Check Yodeck App refresh settings
Need a Custom ServiceNow Dashboard?
If you’re looking for a bespoke ServiceNow dashboard to display on Yodeck using the Grafana app, our team can build it for you.
Custom dashboards are a paid service.
Submit the form, and we’ll get in touch with details and pricing.
👉 Request a Custom ServiceNow Dashboard via this Google Form 👈
Need Help?
The Yodeck Support Team can help you out! Log in to your Yodeck account and send us a message from the bottom right corner!