


A closer look at how screens are being used across the healthcare industry, based on first-party Yodeck data and customer-reported outcomes.
Key takeaways
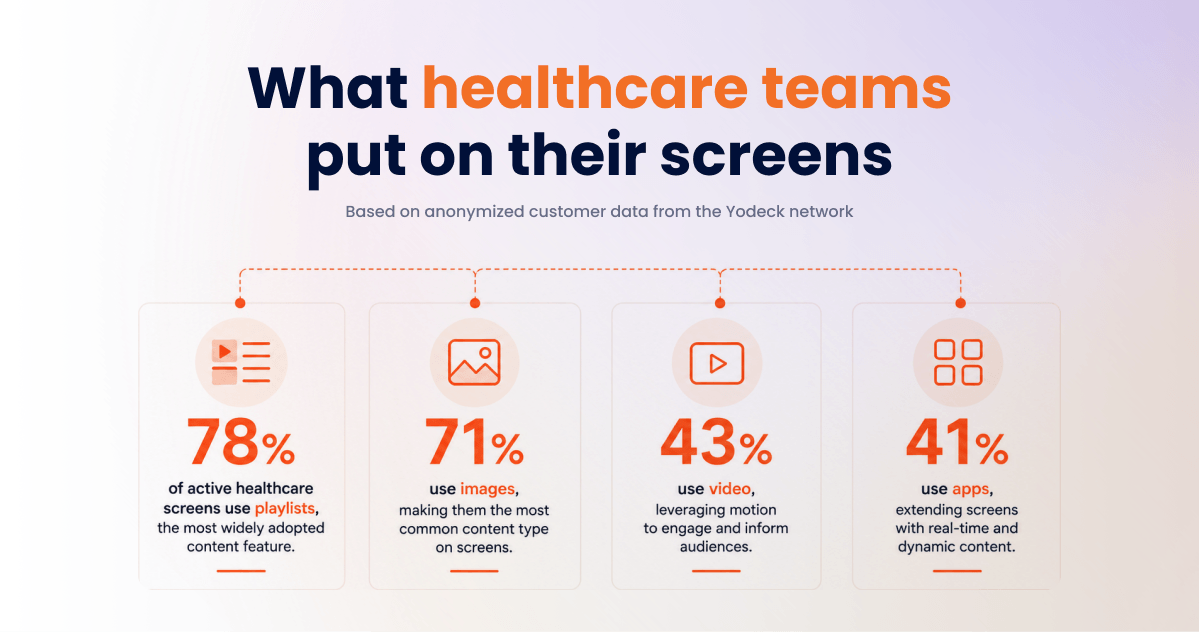
78% of active healthcare screens use playlists, the most widely adopted content feature.
Images appear on 71% of active screens, followed by video at 43% and apps at 41%.
50%+ reduction in negative feedback about waiting times, according to Yodeck Insights Survey.
10+ hours saved per week on both repetitive patient questions and updating health communications and offers.
Healthcare organizations use digital signage to deliver a mix of practical information and visual content across their screens.
To understand how the sector uses digital signage, we analyzed anonymized customer usage data from healthcare organizations on the Yodeck platform between August 27, 2025, and August 27, 2026. The analysis covers 4,002 healthcare organizations and 13,923 active healthcare screens from direct Yodeck customers. These healthcare digital signage statistics cover app and feature adoption over the same 12-month period.
One finding stands out immediately: playlists are used on 78% of active healthcare screens, while images appear on 71%. App adoption also shows a strong presence of practical, at-a-glance information, with weather and time apps ranking prominently across healthcare screens.
Which apps are most widely adopted?
Weather and time content is particularly prominent among digital signage apps with the highest adoption of active screens in healthcare.
Weather Wall
Weather Wall has the highest active-screen adoption among the healthcare apps analyzed, appearing on 10.5% of active screens.
Date & Time
Date & Time app ranks second, appearing on 9.7% of active healthcare screens.
Its position alongside several weather apps places practical information near the top of the healthcare app adoption data.
Daily Weather
The Daily Weather app appears on 8.8% of active healthcare screens, giving weather apps two of the top three positions in the dataset.
The Instagram app reaches 3.4% of active healthcare screens, making social media another visible part of the app mix.
Current Weather
The Current Weather app appears on 4.3% of active healthcare screens.
With Weather Wall and Daily Weather also ranking in the top five, weather apps account for three of the five apps with the highest active-screen adoption in the healthcare dataset.
Custom RSS
Custom RSS appears on 2.5% of active healthcare screens, adding feed-based news content to the mix.
Other everyday apps
The broader app data reinforces the variety of content displayed across healthcare screens. Analog Clock appears on 2.4% of active screens, while Canva appears on 2.1%.
News apps are also represented further down the adoption data, including ESPN, BBC and Google News.
Rather than pointing to one dominant app category, the data shows healthcare screens combining weather, time, social media, news, general content and business tools.
How do healthcare organizations manage screen content?
Apps tell us what types of information appear on healthcare screens. Feature adoption provides another perspective on how that content is organized and delivered.
Playlists are the most widely adopted content feature in the healthcare dataset, appearing on 78% of active screens.
Images follow closely at 71%. Video appears on 43% of active healthcare screens, while apps appear on 41%.
This means visual and dynamic content formats have substantial adoption across healthcare screens: more than seven in ten use images, while more than four in ten use video.
Other content management features also appear across the dataset. Working Hours are used on 24% of active healthcare screens, Layouts on 22%, and PDFs on 17%.
The prominence of playlists alongside images, video and apps shows that healthcare organizations are not limited to a single content format. Instead, the feature data reflects a mix of formats that can be organized and displayed across screens.
What stands out about screen content?
One of the strongest patterns in the app data is the prominence of weather and time information.
Weather Wall, Daily Weather and Current Weather all rank among the five apps with the highest active-screen adoption. Date & Time ranks second overall, while Analog Clock also appears among the more widely adopted apps.
At the same time, the dataset is not limited to utility content. Instagram, Custom RSS, Canva and several news apps also appear in the adoption data.
The result is a varied content mix: practical information sits alongside social, news, visual and business content across healthcare screens.
Importantly, the data tells us what content and features healthcare organizations adopt, rather than the specific audience or purpose behind each use. It therefore provides a first-party view of actual digital signage usage without assuming how individual healthcare organizations deploy each app.
What do healthcare digital signage statistics tell us?
Across the healthcare data, two findings are particularly clear.
First, healthcare screens make extensive use of playlists and visual content. Nearly four in five active screens use playlists, and more than seven in ten use images. Video and apps each appear on more than four in ten screens.
Second, weather and time apps have a strong presence in app adoption. Three of the five apps with the highest active-screen adoption are weather apps, while Date & Time ranks second overall.
These healthcare digital signage statistics point to a combination of practical information and flexible content formats across the sector, rather than a single dominant content type.
What outcomes do healthcare customers report?
Usage data shows how healthcare organizations use digital signage, but customer-reported outcomes provide another perspective on its impact.
According to the 2026 Yodeck Insights Survey, healthcare customers reported:
1. More than a 50% reduction in negative feedback about waiting times
2. At least 10 hours per week saved by reducing repetitive patient questions
3. At least 10 hours per week saved updating health communications and offers
These findings complement the usage data by showing the outcomes healthcare customers report after deploying Yodeck, from reducing repetitive communication to saving time on content updates.
How does healthcare compare with manufacturing?
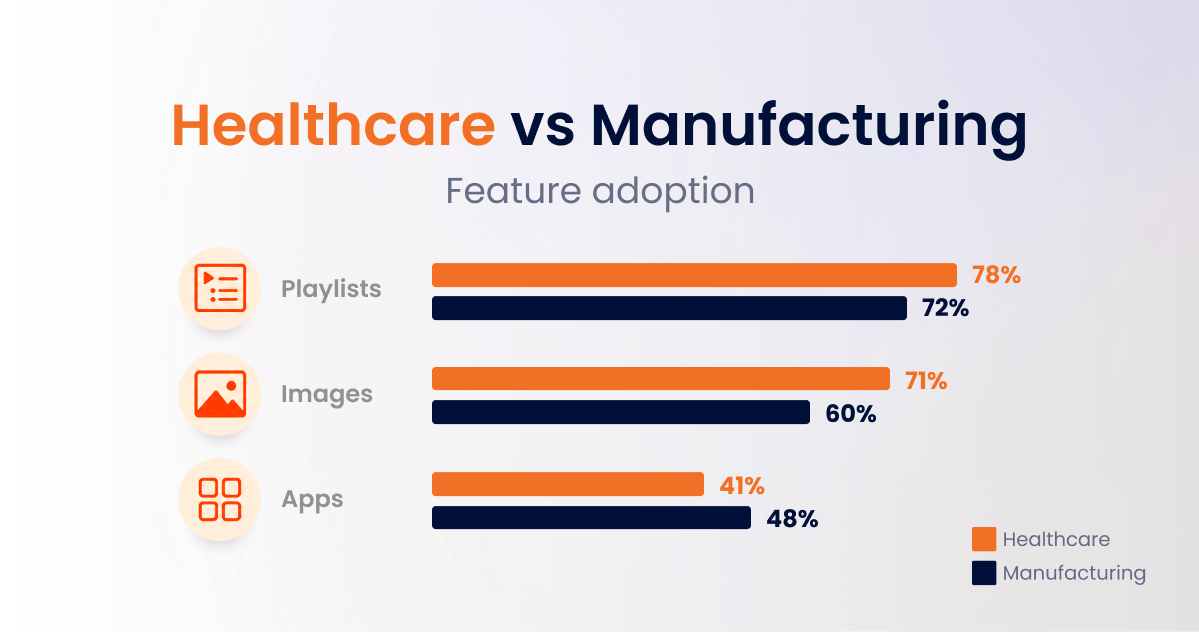
In the previous edition of the Digital Signage Impact series, we looked at digital signage adoption in manufacturing. Comparing feature adoption across the two industry datasets reveals some notable differences.
Healthcare shows higher adoption of playlists and images than manufacturing. Playlist adoption reaches 78% in healthcare, compared with 72% in manufacturing, while image adoption stands at 71%, compared with 60%. App adoption moves in the opposite direction, at 41% in healthcare compared with 48% in manufacturing.
About the data
This report combines anonymized Yodeck platform usage data with selected findings from Yodeck Insights.
The platform usage analysis covers healthcare organizations on the Yodeck platform between August 27, 2025 and August 27, 2026, including 4,002 healthcare organizations and 13,923 active healthcare screens from direct Yodeck customers.
We analyzed app adoption and feature adoption over the same 12-month period to identify patterns in healthcare digital signage usage.
The report also includes selected findings from the 2026 Yodeck Insights Survey. These figures represent outcomes reported by participating healthcare customers and are separate from the platform usage data used for the app and feature adoption analysis.
All findings are aggregated at the industry level and do not identify individual Yodeck customers. No third-party market estimates or industry projections were used.
FAQs
What do hospitals display on digital signage?
Hospital digital signage can be used for wayfinding, check-in information, patient education, safety messages, emergency alerts, staff communications, cafeteria information, donor recognition, and general announcements. Screens can also display real-time content such as weather, news, schedules, and other useful information through digital signage apps.
What is the most used digital signage app in healthcare?
According to Yodeck’s anonymized healthcare usage data analyzed for this report, Weather Wall has the highest active-screen adoption among the apps included in the dataset, at 10.5%.
Weather and time content also ranks prominently overall, with Weather Wall, Date & Time, Daily Weather and Current Weather appearing among the more widely adopted apps.
What should go on a waiting room screen?
Waiting room screens should prioritize information that is clear, useful, and easy to scan. Content can include estimated wait times, clinic information, short educational videos, hygiene and safety reminders, wayfinding, service updates, and calming visual content. Yodeck also recommends rotating content through playlists so screens remain useful without overwhelming patients and visitors.
How do hospitals keep screen content updated across multiple sites?
With cloud-based digital signage software, hospitals can centrally manage screens across departments, buildings, or multiple locations. Yodeck allows teams to remotely publish content, use playlists and layouts, schedule content by time or day, assign different content to different screens, and manage multi-site screen networks from one platform.
Where should screens go in a hospital or clinic?
Common locations include entrances, reception desks, waiting rooms, corridors, staff areas, cafeterias, and other high-traffic areas. The best placement depends on the audience and purpose of each screen: for example, entrance and corridor displays can support wayfinding, while staff-area screens can communicate internal updates and reminders.
Is digital signage in healthcare HIPAA compliant?
Digital signage can be used in healthcare environments while respecting HIPAA requirements, but protected health information (PHI) should not be displayed on public screens. General content such as wayfinding, patient education, cafeteria information, and announcements does not itself involve PHI. For queue or check-in displays, Yodeck recommends using identifiers such as ticket numbers or initials rather than full patient names. Any integration involving clinical systems or PHI requires the appropriate privacy and security safeguards.
More from the Digital Signage Impact series
The Digital Signage Impact series uses anonymized Yodeck usage data to uncover how digital signage adoption and content trends vary across industries.
Digital Signage Impact No. 1: What companies put on their screens
Digital Signage Impact No. 2: Manufacturing digital signage statistics
Digital Signage Impact No. 3: Healthcare digital signage statistics (current article)