MANUFACTURING KPIs DASHBOARD
Drive productivity,
boost alignment
Use a manufacturing KPIs dashboard to ensure that your factory production processes are running smoothly and efficiently. By implementing a dashboard template, you can keep track of key performance indicators across various operations.


Benefits of using a manufacturing KPI dashboard
Make decisions
Manufacturing KPI dashboards help you make better decisions. Display your key performance and production performance to evaluate opportunities.
Increase efficiency
Display efficiency KPIs to track goals and optimize machinery performance, reducing downtime and boosting production efficiency.
Save money
A KPI dashboard template can help the manufacturing company monitor the total manufacturing cost and see how they can reduce expenses.

Help alignment
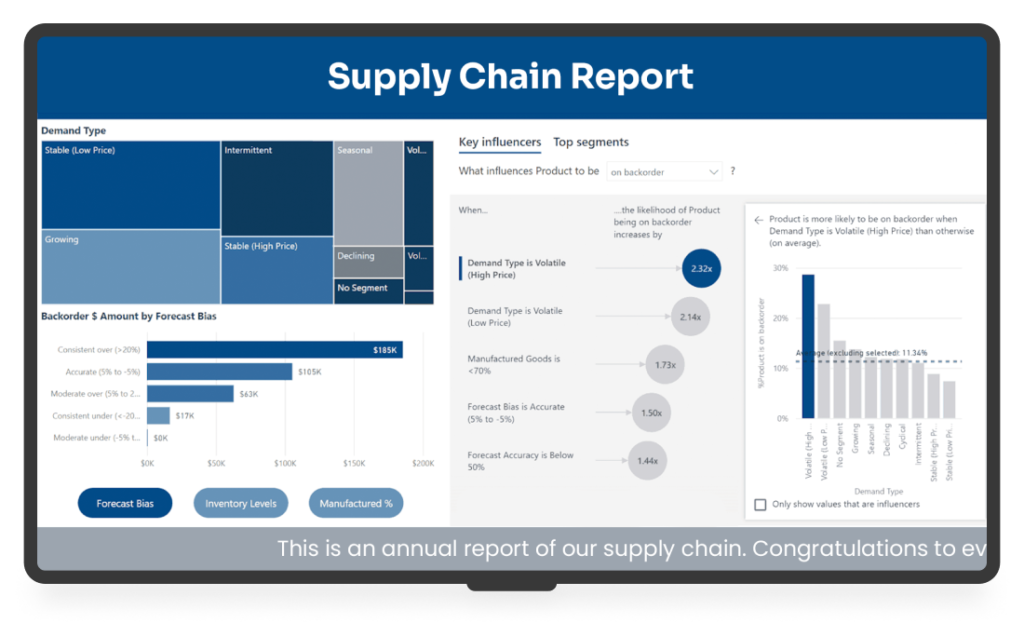
Streamline communication between departments with manufacturing dashboard digital signage. Use the dashboard to enhance supply chain visibility.

Improve quality
Display manufacturing KPI dashboard template to provide KPI performance. Identify and address problems easily and quickly.
Enhance visibility
Utilize a digital manufacturing metrics dashboard to provide visibility into the performance of all processes .
YODECK APPS
Elevate your content
Yodeck offers plenty of dynamic and easy-to-use apps to help you display manufacturing KPI metrics. Use PowerBI , Grafana , and Tableau to showcase KPIs in the manufacturing industry. They are free and you need seconds to set them up. These tools are perfect for enhancing (KPI performance) and ensuring that your data is always up-to-date and actionable.

Manufacturing KPIs Dashboard: FAQs
Digital signage turns a static dashboard for manufacturing industry teams into a live communication tool across the facility. Instead of being accessible only to managers, KPIs can appear on shared screens in production areas, shift handover points, break rooms, and operations offices. This boosts transparency, speeds response, reduces unnecessary meetings, and aligns production, maintenance, quality & supply teams in real time.
Common manufacturing dashboard examples include:
- Production dashboards (output, cycle time, availability)
- Quality dashboards (defects, yield, rework)
- Maintenance dashboards (MTBF, MTTR, open tickets)
- Safety dashboards (incident rates, compliance)
- Supply chain dashboards (inventory, supplier OTIF)
Each dashboard supports a different operational objective.
A production KPI dashboard on digital screens gives teams instant visibility without leaving their workstations. When targets slip or downtime spikes, teams can react immediately rather than wait for end-of-shift reports. This improves shift alignment, reduces communication gaps, and reinforces accountability by keeping performance visible throughout the day.
The key is clarity: focus on 5–10 actionable KPIs per screen to avoid overload and support fast decision-making, such as:
Maintenance status: Current equipment service condition
- OEE: Overall machine performance score
- Downtime by cause: Reasons machines stopped running
- First-pass yield: Products correct first attempt
- Scrap rate: Percentage of wasted materials
- Takt time: Required production pace
- On-time delivery: Orders shipped by deadline
Yes. Yodeck supports Tableau KPI dashboard and Power BI KPI dashboard integrations, allowing you to display live reports directly on screens. You can also showcase a Power BI manufacturing dashboard in full-screen mode or within layouts that combine KPIs with safety alerts, shift updates, or HR announcements for broader operational visibility.
No. Modern manufacturing signage platforms are cloud-based and IT-light. Once dashboards are connected, updates sync automatically. If a screen reboots or temporarily loses connectivity, playback resumes without manual resets. This level of reliability makes KPI displays well-suited for production environments, where minimizing downtime and avoiding unnecessary technical complexity are essential.
Reliability is paramount in a 24/7 industrial environment. Yodeck’s manufacturing dashboard software caches all layout assets and media locally on the player, so the screen will never go blank. It will continue to display the last cached data point and all other dashboard signage content (like safety videos) until the connection is restored.
Yes. Yodeck is one of the best platforms for managing global manufacturing KPIs and dashboards because it supports Workspaces,, and centralized cloud control. Corporate teams can push standardized KPI displays globally, while local plants adjust specific metrics. This ensures consistent reporting across regions without sacrificing local operational flexibility.
Manufacturing dashboard software cost depends mainly on how many KPI screens you need across lines, departments, or sites. Yodeck uses straightforward per-screen digital signage pricing starting at $8 per screen per month so that you can begin with a few displays and scale predictably. Compared to manual reporting & printed boards, most teams see fast ROI through faster decisions and fewer meetings.
Manufacturing digital signage improves operations by making the right information visible, in real time, where teams actually work.
- Implement Wayfinding to guide staff, contractors, and visitors safely across large facilities
- Share SOPs, safety, maintenance, and shift updates via Manufacturing Information Displays
- Add TV Dashboard Displays for real-time dashboards in shared areas
- Use Internal Communications for plant-wide announcements and alignment


